DATA Tab
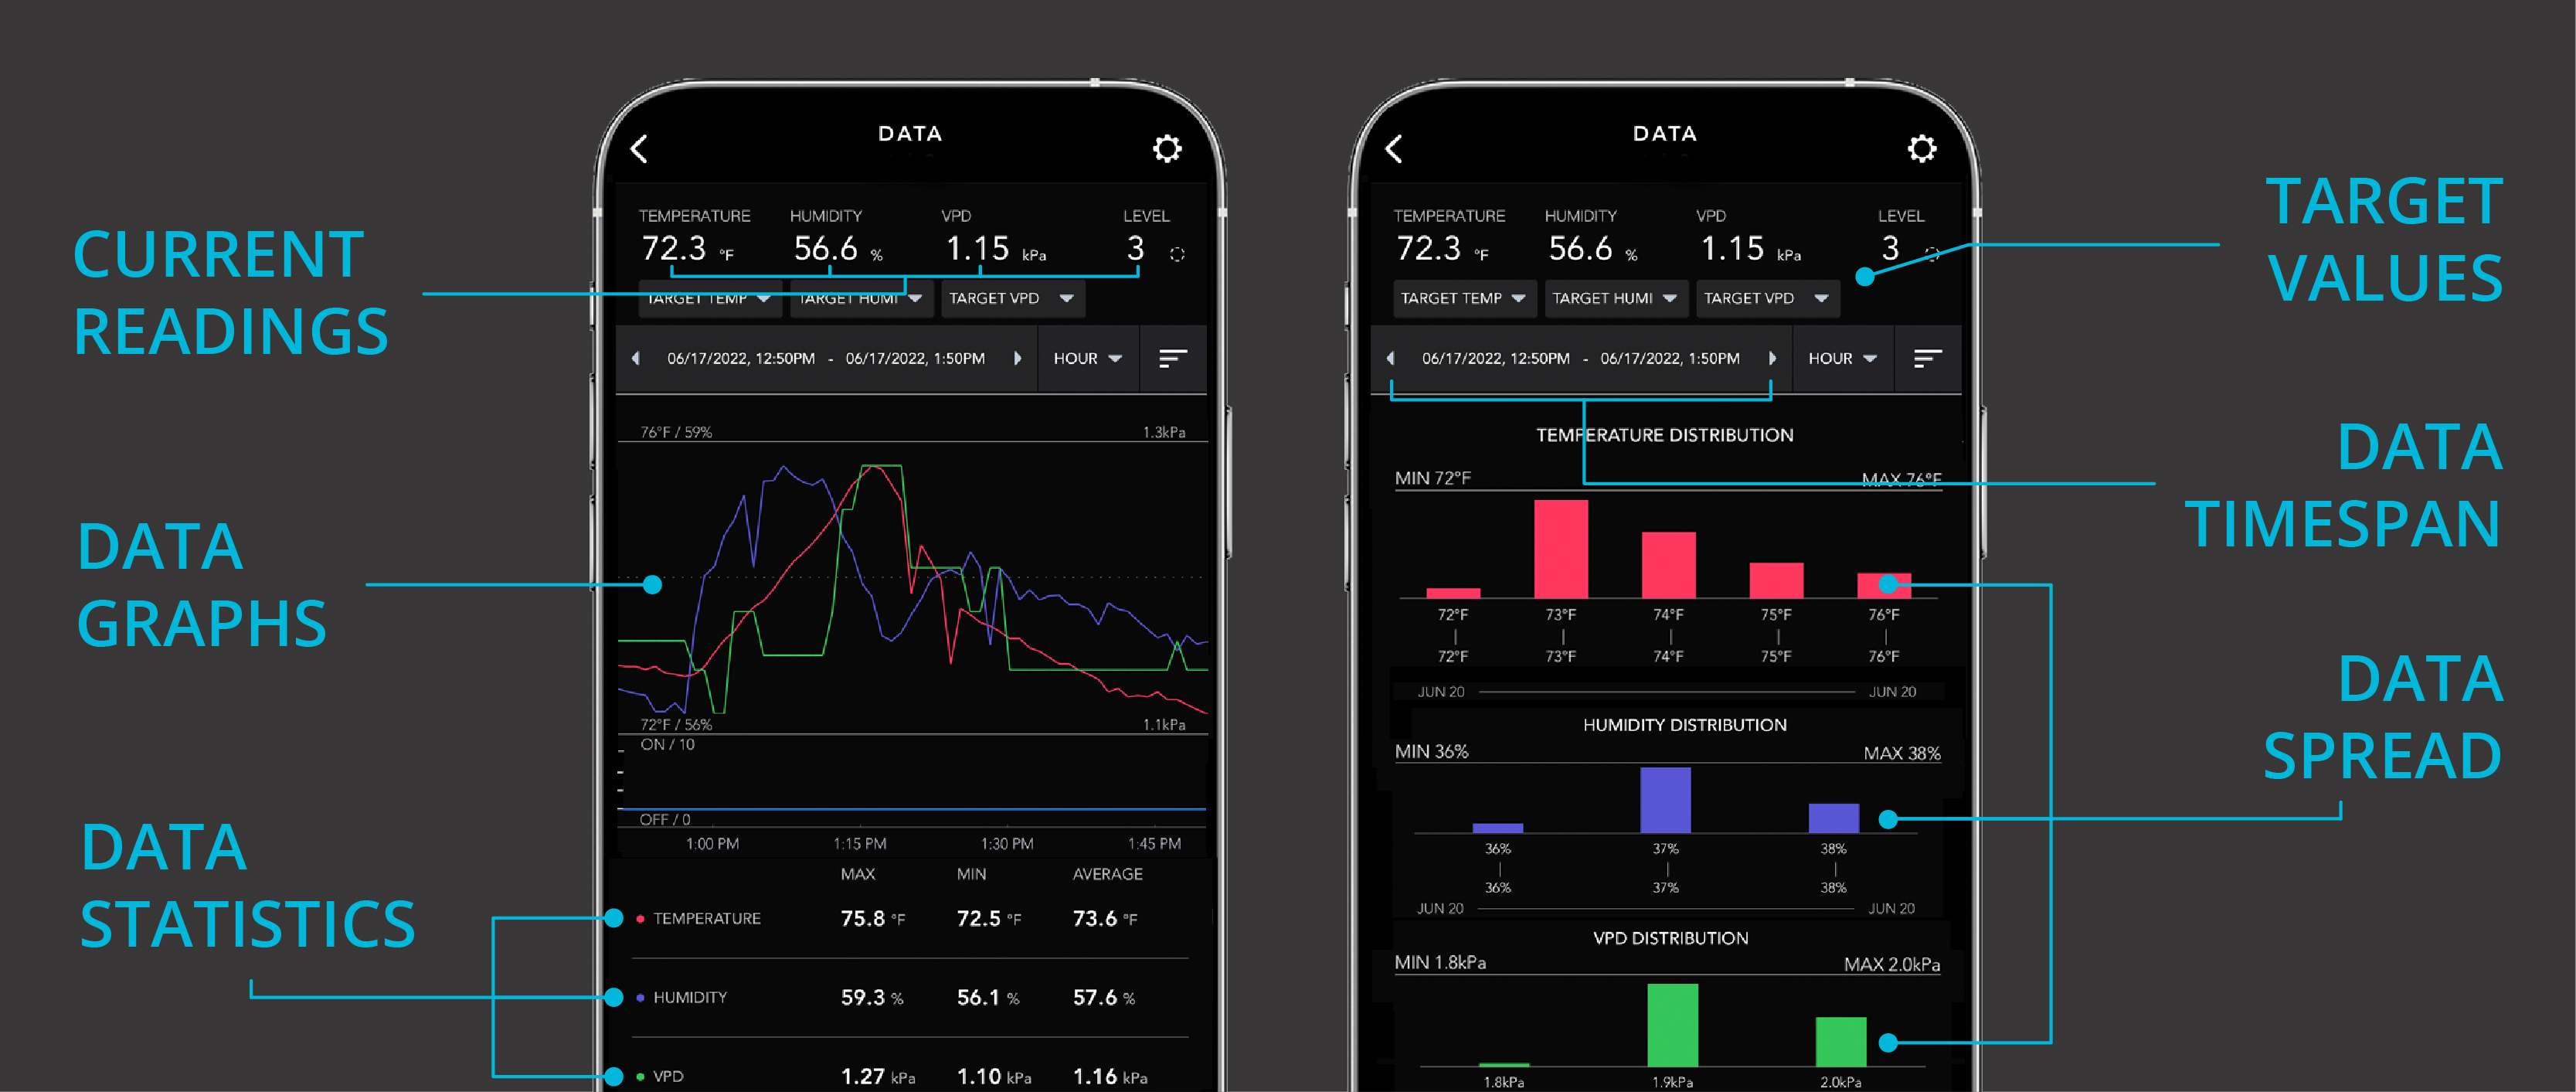
This section stores quantitative data that is recorded by the controller. You can tap each time interval (hour, day, week, month, or year) at the top of your screen to see the spread of the climate data. Temperature and humidity readings are displayed in fluctuation charts and allow you to see how your space’s climate varies. Temperature and humidity distribution are represented by bar graphs and tell you the most common climate condition within a given time interval. You can export this data as a CSV spreadsheet file to log and track it on your PC.


