VPD Chart: What It Is, How to Read It, and How to Use It
If you're trying to dial in the environment inside a grow tent, you've probably come across a VPD chart. Unlike simply watching temperature or relative humidity, a VPD chart shows how those conditions work together and gives you a more complete picture of the environment around your plants.
- VPD stands for Vapor Pressure Deficit and describes the difference between how much moisture the air can hold and how much moisture is actually present.
- A VPD chart connects temperature, relative humidity, and VPD so you can evaluate environmental conditions together.
- The appropriate VPD range changes based on the plant's growth stage.
- Use temperature and humidity readings to find your current VPD, compare it with your target range, and adjust conditions when necessary.
VPD stands for Vapor Pressure Deficit. It describes the difference between how much moisture the air can hold and how much moisture is actually present. For indoor growers, VPD can be used alongside temperature and humidity measurements to monitor environmental conditions throughout different stages of plant growth.
The good news is that using a VPD chart doesn't have to be complicated. Once you understand what VPD means, you can use your temperature and humidity readings to find your current VPD, compare it with an appropriate range, and make adjustments when necessary.
What Is a VPD Chart?
A VPD chart is a reference that connects temperature, relative humidity, and vapor pressure deficit. VPD is measured in kilopascals, or kPa.
Temperature matters because warmer air can hold more moisture than cooler air. Relative humidity tells you how much moisture is currently present in the air compared with the amount it could hold at that temperature.
This is why humidity alone doesn't always tell the whole story. For example, 60% relative humidity at 65°F does not represent the same atmospheric conditions as 60% relative humidity at 80°F. The temperature changes how much moisture the air can hold, which changes the resulting VPD.
A VPD chart puts that relationship into an easy-to-read reference so you can see where your environment falls.
How to Read a VPD Chart
Reading a VPD chart is easier when you focus on the relationship between growth stage, VPD, temperature, and relative humidity:
| Growth Stage | VPD Range (kPa) | Temperature (°F / °C) | Relative Humidity (RH) |
|---|---|---|---|
| Germination Encourages root development and healthy early growth. |
0.2 – 0.8 | 70 – 80°F (21 – 27°C) |
70 – 80% |
| Seedling Supports strong roots and steady growth. |
0.6 – 1.1 | 70 – 80°F (21 – 27°C) |
60 – 70% |
| Vegetative Promotes vigorous growth and larger foliage. |
0.6 – 1.4 | 70 – 80°F (21 – 27°C) |
50 – 70% |
| Flowering Supports bud development and resin production. |
0.8 – 1.8 | 70 – 80°F (21 – 27°C) |
40 – 60% |
What Is VPD?
VPD is the difference between the amount of water vapor in the air and the maximum amount the air can hold at a given temperature. It's measured in kilopascals (kPa) and combines temperature and relative humidity into one useful measurement.
Monitoring VPD helps you understand how temperature and humidity are interacting around your plants throughout each stage of growth.
How to Use the VPD Chart
- Identify Your Growth StageDetermine whether your plants are in germination, seedling, vegetative, or flowering.
- Check Your EnvironmentMeasure your current temperature and relative humidity.
- Find Your VPDUse your temperature and humidity readings to determine your current VPD.
- Make AdjustmentsAdjust temperature, humidity, or airflow when conditions consistently fall outside your desired range.
VPD = SVP − AVP
SVP = Saturation vapor pressure • AVP = Actual vapor pressure
- VPD is measured in kPa.
- VPD combines temperature and relative humidity into a single environmental measurement.
- The appropriate VPD range changes based on the plant's growth stage.
Start by taking your current temperature and relative humidity readings. Locate those conditions on the chart and find the corresponding VPD.
For example, if your grow environment is 75°F and 60% relative humidity, you can use those two measurements to find the corresponding VPD. You can then compare that value with the recommended range for your plant's current growth stage.
Think of temperature and humidity together
This is the main benefit of a VPD chart. Instead of looking at temperature and humidity as two separate numbers, you can understand how they interact.
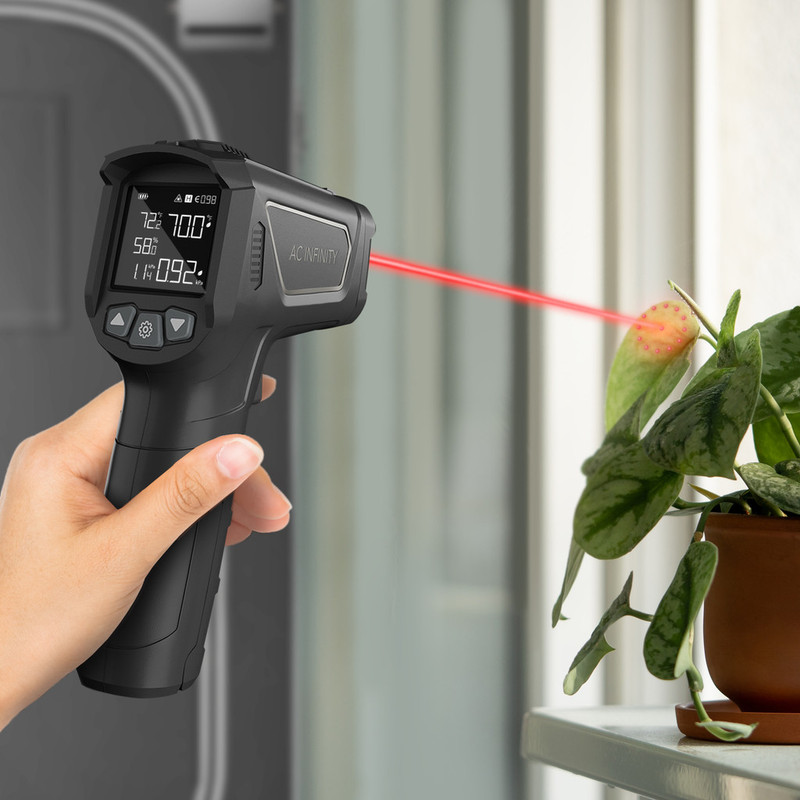
Monitoring VPD With the AC Infinity VPD Thermometer
For growers who want a more direct way to monitor environmental conditions, the AC Infinity VPD Thermometer provides a natural companion to a VPD chart.
Instead of manually checking temperature and humidity and then referring back to a chart, a dedicated VPD monitoring device can provide the environmental information needed to understand where your grow currently sits.
This makes the VPD Thermometer particularly useful when conditions fluctuate throughout the day. Rather than treating VPD as something you check once, you can use environmental measurements to observe how your grow changes as temperature and humidity move.
The basic workflow remains the same: measure the environment, compare the reading with your target range, and adjust your growing conditions when necessary.
Using SPECTRON 7 for Plant-Level Monitoring
VPD becomes even more useful when you can see what's happening at the plant level.
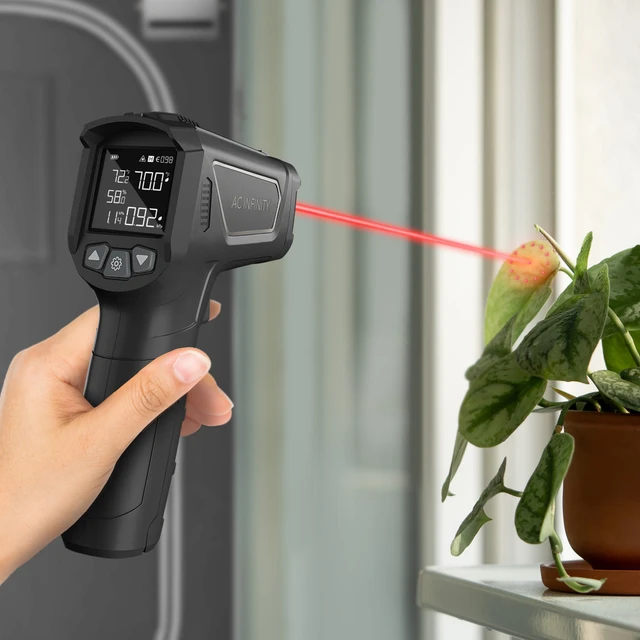
The AC Infinity SPECTRON 7 combines plant monitoring with thermal imaging and environmental sensing, providing another way to understand conditions inside the growing environment. Its thermal imaging capabilities can help identify temperature differences across the plant canopy, while its climate sensors provide additional environmental data.
That makes SPECTRON 7 a natural complement to a VPD-focused setup. A VPD chart tells you what environmental range you're targeting, while plant-level monitoring can provide more information about the conditions your plants are actually experiencing.
For growers using environmental data to make decisions, this distinction matters. The temperature of the room and the conditions immediately around the plant don't always tell exactly the same story.
Common VPD Chart Mistakes
Focusing Only on Humidity
Relative humidity is important, but it doesn't exist independently from temperature. A humidity reading should be considered alongside temperature when evaluating VPD.
Chasing One Exact Number
VPD charts provide ranges for a reason. Your goal isn't necessarily to keep the environment locked to one exact decimal value.
Ignoring Temperature Changes
If temperature changes, VPD can change even when humidity doesn't. This is especially important when lights turn on and off.
Making Constant Adjustments
Environmental conditions naturally fluctuate. Constantly changing equipment because of small variations can create unnecessary instability.
Instead, monitor trends and make adjustments when conditions consistently move outside your desired range.
VPD Chart FAQs
What does VPD mean?
VPD stands for Vapor Pressure Deficit. It describes the difference between how much moisture the air can hold and how much moisture is actually present.
What is a good VPD for seedlings?
AC Infinity's environmental guide lists 0.6–1.1 kPa for seedlings, with temperatures of 70–80°F and relative humidity of 60–70%.
What is a good VPD for vegetative growth?
AC Infinity's guide lists 0.6–1.4 kPa for vegetative growth, with temperatures of 70–80°F and relative humidity of 50–70%.
What is a good VPD for flowering?
AC Infinity's guide lists 0.8–1.8 kPa for flowering, with temperatures of 70–80°F and relative humidity of 40–60%.
Does temperature affect VPD?
Yes. Temperature affects how much moisture air can hold, so changes in temperature can change VPD even when relative humidity remains constant.
Is VPD better than humidity alone?
VPD provides additional context by considering temperature alongside humidity. It shouldn't necessarily replace other environmental measurements, but it can be a useful tool for understanding and managing the growing environment.
Understanding Your Grow Environment With VPD
VPD gives indoor growers a way to understand temperature and relative humidity as connected environmental conditions rather than isolated measurements.
The goal isn't to chase one exact number. It's to understand the range that's appropriate for your plant's current growth stage and monitor how your environment changes over time.
Whether you're using a VPD chart, the AC Infinity VPD Thermometer, or plant-level monitoring with SPECTRON 7, the workflow stays consistent: measure your environment, compare it with your desired range, and make adjustments when conditions consistently move outside that range.
View the VPD Thermometer →